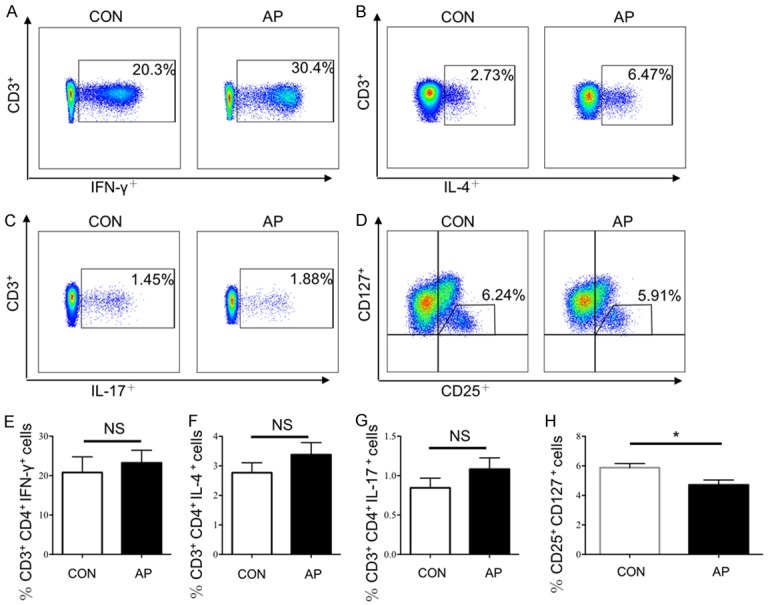
Figure 3.

The proportion of T help cells and Treg cells in AP patients. The proportion of T help cells and Treg cells in AP patients (n=14) and HCs (n=7) were detected by flow cytometry. A. Representative flow cytometry figure of the proportion of Th1 cells; B. Representative flow cytometry figure of the proportion of Th2 cells; C. Representative flow cytometry figure of the proportion of Th17 cells; The proportion of Treg cells and Treg cells in AP patients (n=35) and HCs (n=20) were detected by flow cytometry. D. Representative flow cytometry figure of the proportion of Treg cells; E-H. Statistical analysis of: E. Proportion of Th1 cells; F. Proportion of Th2 cells; G. Proportion of Th17 cells; H. Proportion of Treg cells; Results are expressed as mean ± SEM, NS: no significant difference, *, P < 0.05; **, P < 0.01; ***, P < 0.001, ****, P < 0.0001.
