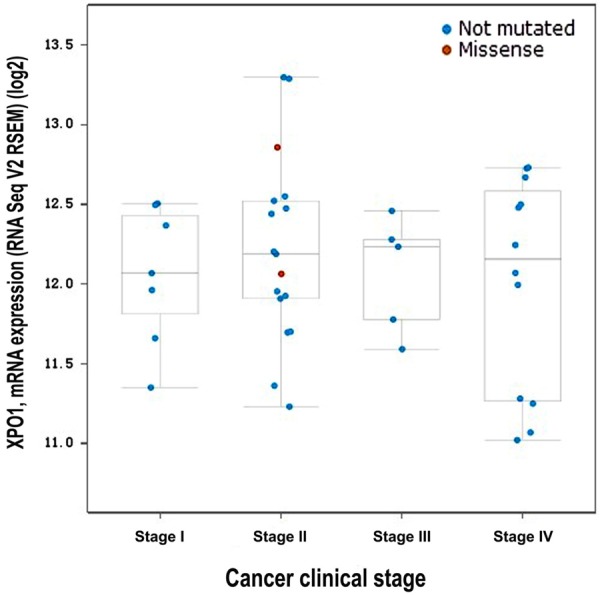
Figure 6.

Connection between the XPO1 mRNA level and the clinical stage in DLBCL (TCGA, provisional). The log2 mRNA expression levels from RNA Seq V2 RSEM were downloaded from TCGA data. The Plot figure was drawn using cBioPortal (www.cbioportal.org) to show the connection between mRNA expression and the clinical stage (P > 0.05). Annotation: DLBCL, diffuse large B-cell lymphoma; XPO1, exportin-1; TCGA, The Cancer Genome Atlas.
