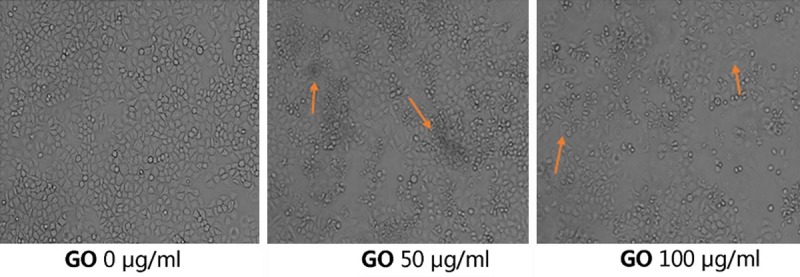
Figure 2.

The HONE1 cells were treated with 0, 50, and 100 μg/ml GO for 6 h and the cell morphology is shown. Compared with the control group, some dead cells were observed in the GO group; however, most HONE1 cells were necrotic, and the morphology of the cells was changed in the 100 μg/ml GO group.
