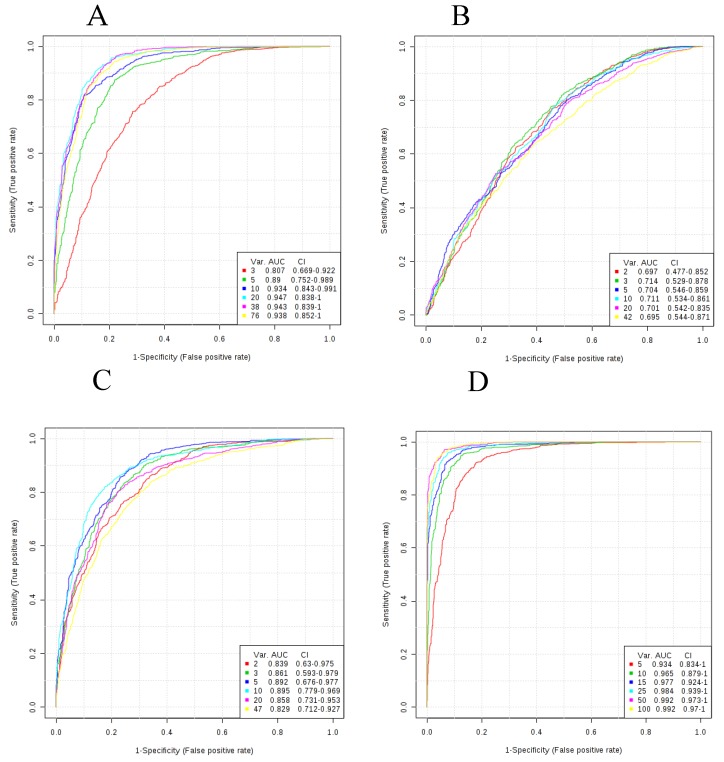
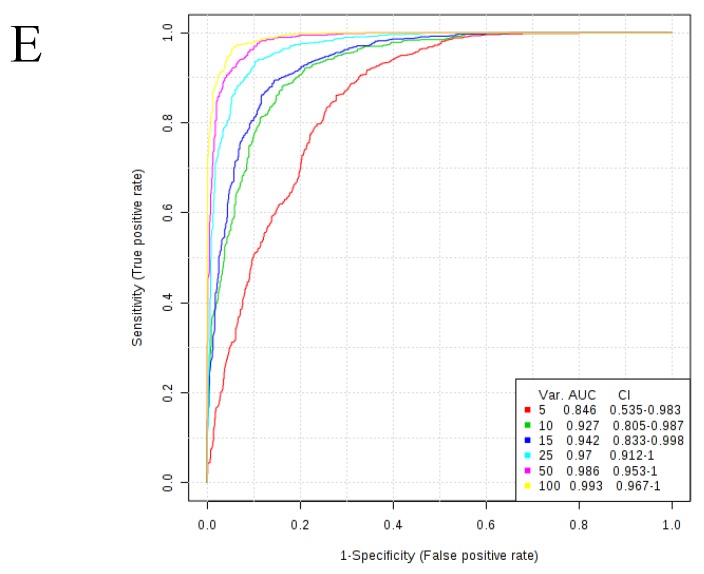
Figure 1.
ROC curves for SVM signatures based on each of the metabolite classes. Plots reflect average performance across all Monte Carlo cross validation runs. (A) Small molecules; (B) Bile acids; (C) Free fatty acids; (D) Lipids; (E) All metabolites. All 95 percent confidence intervals (CIs) were computed. The signature size corresponding to each colored curve is shown under the “Var” heading shown in the key for each plot.


