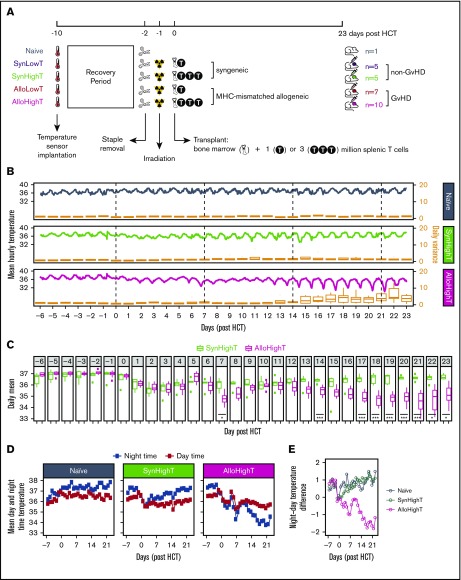
Figure 1.
Overview of the experimental design and descriptive statistics of the results for naive, SynHighT, and AlloHighT mice. (A) A total of 28 mice was studied, including 1 naive mouse, 10 mice that received syngeneic HCT with 1 million (SynLowT) or 3 million (SynHighT) T cells, and 17 mice that received allogeneic HCT with 1 million (AlloLowT) or 3 million (AlloHighT) T cells. Body core temperature was sampled every 24 seconds from 10 days before HCT (day of surgical implantation of the temperature sensors) until 23 days after HCT. All transplant mice received irradiation on day −1 and HCT on day 0. (B) Mean hourly temperatures (left y-axes) and boxplots of daily variations in all individuals in each of the 3 groups (right y-axes). Outliers in the boxplots are not shown. (C) Boxplots of mean daily temperature of each individual in the SynHighT and AlloHighT groups. Outliers are shown as small filled squares. P values were calculated for days 0 to 23 using 2-sided Student t tests and adjusted for multiple testing using the Benjamini-Yekutieli method7). (D) Mean daily nighttime temperature and mean daily daytime temperature of all individuals in the naive, SynHighT, and AlloHighT groups. (E) Daily difference in mean daily nighttime temperature and mean daily daytime temperature of all individuals in the naive, SynHighT, and AlloHighT groups. *P < .05, ***P < .005.

