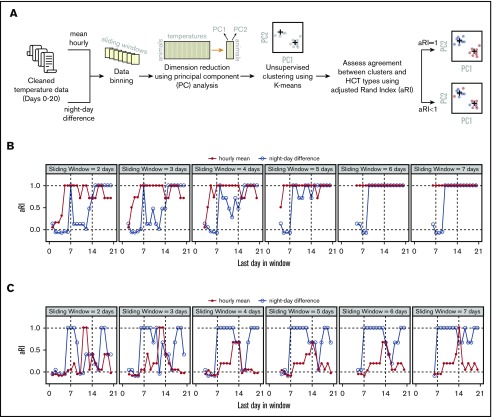
Figure 2.
Temperature data analysis using machine learning. (A) Workflow of data analysis. (B) Concordance between actual and algorithm-generated SynHighT vs AlloHighT classifications when mean hourly temperatures and night–day difference were used as input for clustering. (C) Concordance between actual and algorithm-generated SynLowT vs AlloLowT classifications when mean hourly temperatures and night–day difference were used as input for clustering. Concordance was measured using an adjusted Rand Index (range, −1 to 1; a value of 1.0 corresponds to 100% concordance). The x-axes in panels B and C represent the last day of the sliding window, and the widths are indicated in the top portion of each plot. aRI, adjusted Rand Index.

