Figure 5.
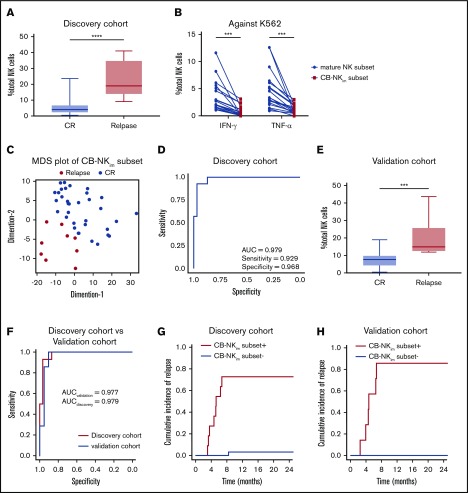
A unique subset of CB-NK cells with a distinct immature phenotype predicts for relapse in the first year post-CBT. (A) Box plots summarizing the distribution of frequencies of the CB-NKim subset in patients who remained in complete remission (CR; blue; n = 34) compared with those who relapsed (red; n = 9). ****P ≤ .0001 (discovery cohort). (B) Cumulative results summarize the IFN-γ and TNF-α responses for the total population of CD56+ NK cells (filled blue circles) and the CB-NKim subset (filled red squares) after coculture with K562 targets for 6 hours. IFN-γ and TNF-α were measured by intracellular flow cytometry after gating on total NK cells vs the CB-NKim subset. P values are calculated by paired Student t test. ****P ≤ .0001. (C) Multidimensional scaling plot constructed on the basis of frequencies of the CB-NKim subset within total NK cell population reveals a distinct segregation between patients who maintained a CR (blue circles; n = 34) and those who relapsed (red circles; n = 9). The distances correspond to differences in the frequencies of the CB-NKim subset. (D) ROC curve analysis indicates the predictive performance (AUC, 0.979) for the CB-NKim subset with a positive percentage cutoff of 11.8% to identify relapsed patients. (E) Box plots summarize the distribution of frequencies of the CB-NKim subset in patients in CR (blue; n = 19) or those who went on to relapse in the first year (red; n = 6). ***P ≤ .001 (validation cohort). (F) Comparison of ROC curve analyses shows the predictive performance of the CB-NKim frequency with a cutoff 11.8% in the discovery (red line; AUC, 0.979) and validation (blue line; AUC, 0.977) cohorts. (G-H) Cumulative incidence of relapse for patients with CB-NKim subset of at least 11.8% (red line) vs less than 11.8% (blue line) in the discovery and validation cohorts, respectively.

