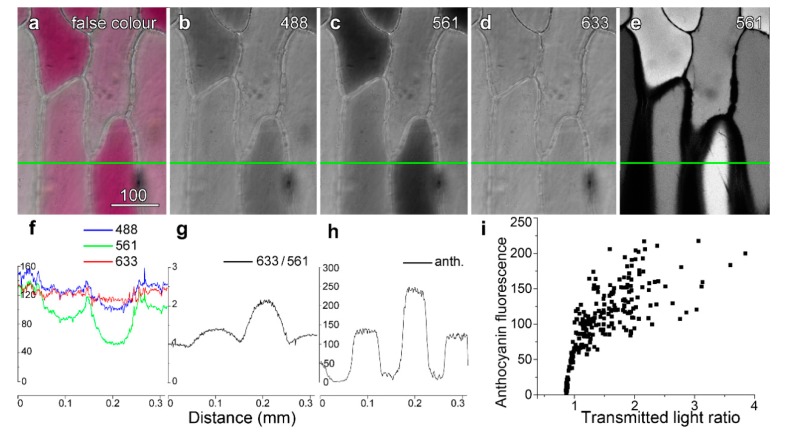
Figure 1.
Quantifying vacuolar anthocyanin. Images were recorded sequentially in line-by-line mode using four-fold averaging. A false colour transmitted light image (a) was created using (b) blue (488 nm), (c) green (561 nm) and (d) red (633 nm) light images, with these collected at the same time as high-intensity 561 nm green excitation to excite anthocyanin (e). Intensity profiles were generated along the green line with ImageJ, and plotted for the three different transmitted light wavelengths. The intensity plot for the green image dropped markedly in the red cell, consistent with green light being absorbed, whereas intensity in the red image dropped only slightly. (f) Dividing the red intensity by the green intensity (T633/T561) provided a convenient measure of the anthocyanin present in the cell, in which variations present in both images such as cell walls and organelles were reduced. (g) Anthocyanin fluorescence intensity. (i) Anthocyanin showed a strong but non-linear correlation with the transmitted light ratio (T633/T561). Bar in (a) = 100 µm for (a–e).

