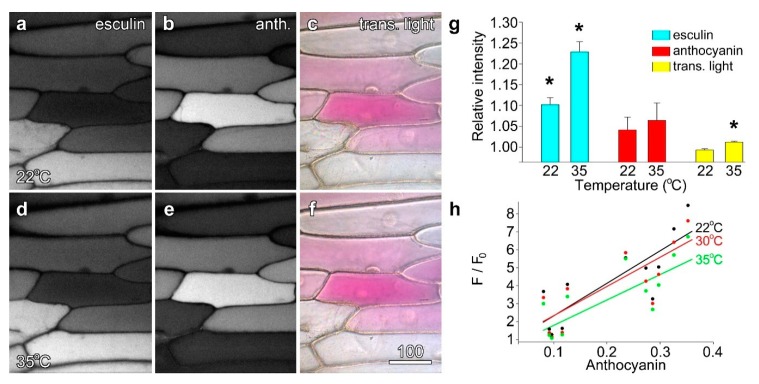
Figure 6.
The quenching of esculin fluorescence was temperature dependent. Esculin (a,d) and anthocyanin fluorescence (b,d), along with false colour transmitted light (c,f), were collected at 22 °C (a–c) and at 35 °C. Esculin fluorescence was slightly but measurably higher at 35 °C (d). Bar in (f) = 50 µm for (a–f). (g) Quantification of esculin fluorescence (blue bars), and anthocyanin measured with fluorescence (red) and by transmitted light ratios (yellow). Data are ratios averaged for n = 12 individual cells, comparing values at the raised temperature to 22 °C. Asterisks indicate values significantly different from 1.00; Student’s t-test, p < 0.05. (h) Stern–Volmer plot (F/F0) for esculin in the presence of anthocyanin showing the temperature-dependence of quenching.

