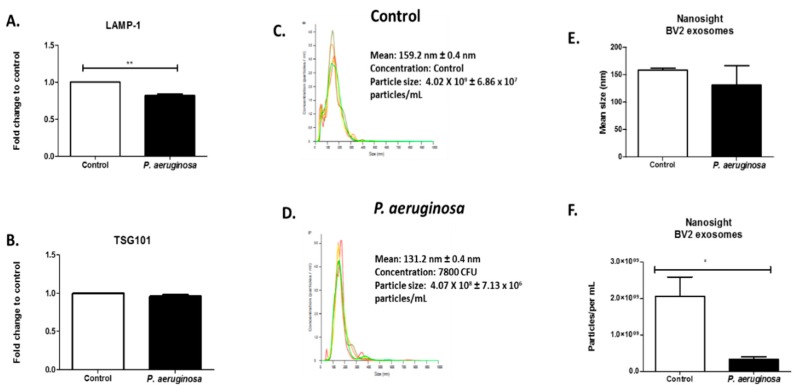
Figure 2.
Quantitation of BV-2-derived EVs after Pseudomonas aeruginosa infection. ELISAs of BV-2-derived EVs at 40 μg were tested for the presence of LAMP-1 (A) and TSG101 (B) proteins. Histogram plot of the concentration of control EVs (C) and P. aeruginosa-derived EVs, 2.6 × 10⁴ CFU/mL initial concentration (D) (N = 1). Different colors indicate different groups of EVs. Size determination and quantitation of BV-2-derived EVs using NTA (C–F). Statistical significance is indicated as (*) p ≤ 0.05 and (**) p ≤ 0.01.

