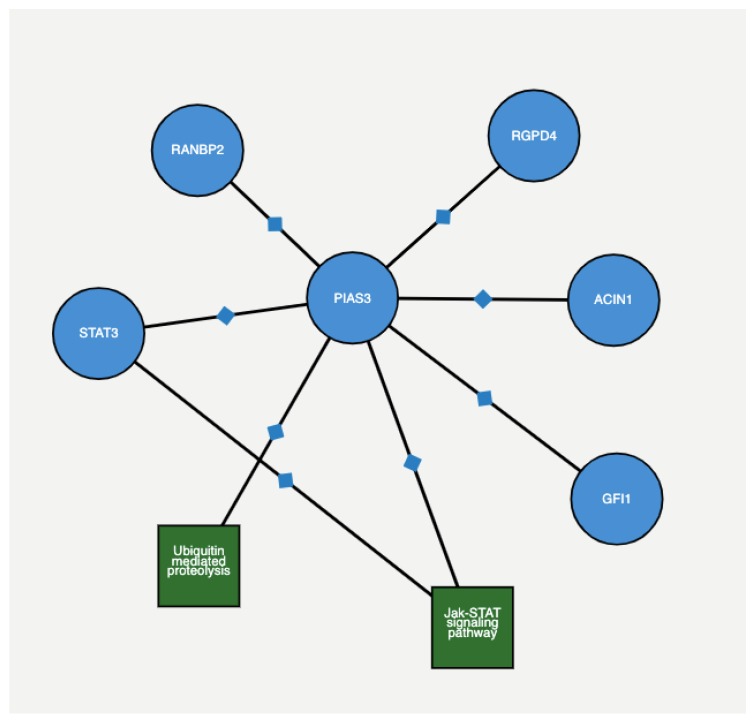
Figure 5.
An interactive figure taken from proteomics database STRING. It shows neighbouring protein binding and pathway interactions for a given gene using STRING and KEGG pathway analysis. Here, the gene of interest is PIAS3, an identified possible biomarker in the 4 + 3 = 7 score. The figure shows the interaction between other proteins and pathways associated with it.

