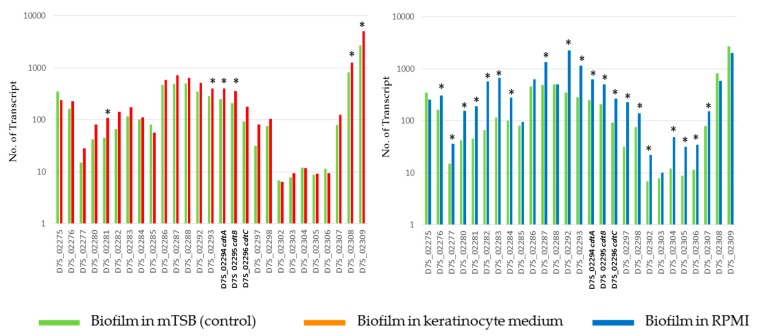
Figure 4.
Expression levels of the 24 Kb cdt-island of D7S-1 biofilm in keratinocyte medium (left panel) or RPMI (right panel) in comparison to control in mTSB. The cdtABC are marked with bold font. See Supplementary Table S3 for annotation of other island genes. * Statistically significant at p < 0.05 by Student’s t-test between biofilm in keratinocyte medium and control.

