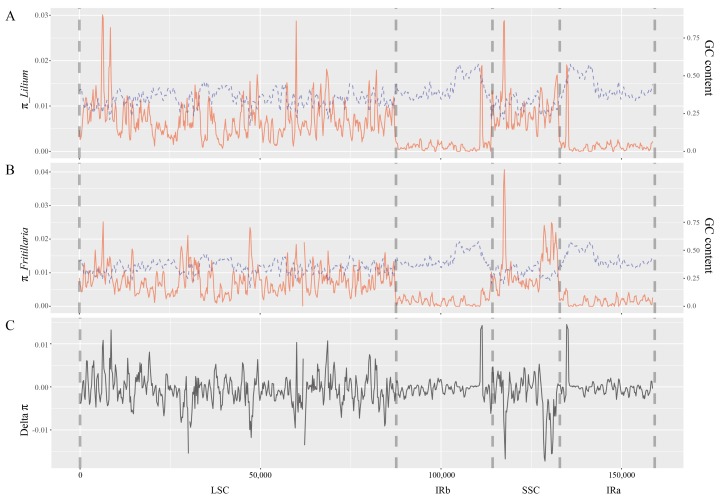
Figure 1.
Nucleotide diversity (π) and GC content throughout the plastome sequence according to sliding window analysis (window size = 600 bp, step size = 200 bp). The red line and blue dashed line refer to π and GC content, respectively. The vertical dashed grey lines refer to the approximate boundaries of the plastome structure.

