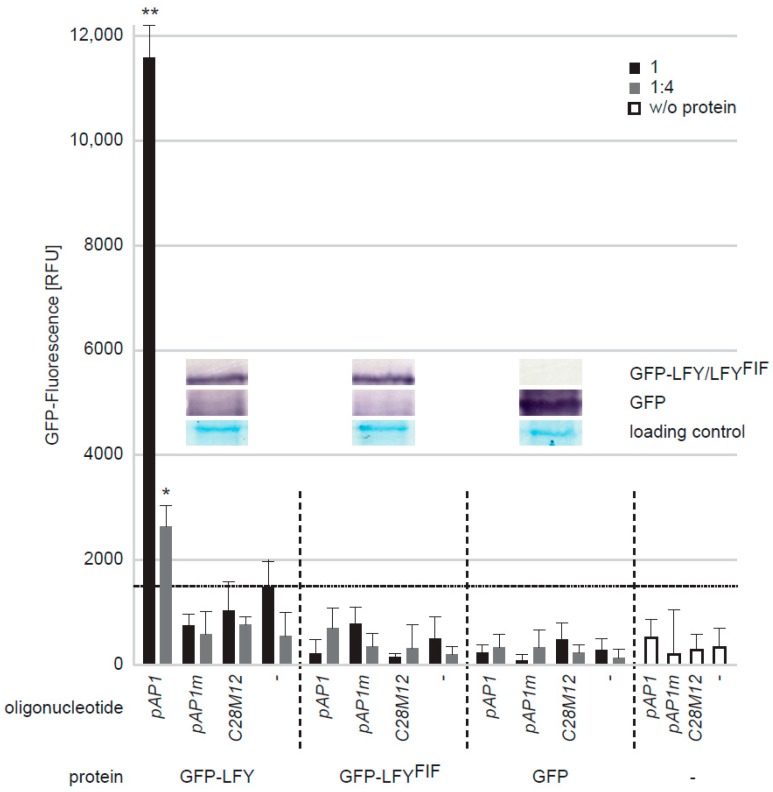
Figure 7.
Comparative analysis of the in vitro DNA-binding capacity of LFY and LFYFIF using a GFP-fluorescence-based DPI-ELISA approach. GFP-LFY, GFP-LFYFIF and GFP were expressed in E. coli. After extraction, crude extracts containing either no recombinant protein (w/o protein) or, based on GFP fluorescence, equal amounts of GFP or the GFP fusion proteins were added to ELISA plates covered with either the double-stranded (ds) DNA oligonucleotide pAP1, which contains a LFY binding site, an altered version of pAP1 (pAP1m), in which the binding site was mutated, a dsDNA oligonucleotide unrelated to the pAP1 and pAP1m sequences (C28M12) or without any DNA-oligonucleotide. The amount of DNA-bound fusion protein was detected by reading out the GFP fluorescence. The crude extract was either used undiluted (black bars) or in a 1:4 dilution (grey bars). Error bars indicate the standard deviation of the mean (n = 3) and asterisk statistically significant differences to the background fluorescence (dotted horizontal line), determined by two-sided t-test (*: p < 0.05; **: p < 0.01). The inlet shows a Western-blot of the crude extracts using a GFP polyclonal antiserum for detection of GFP, GFP-LFY and GFP-LFYFIF as well as a Coomassie stain as loading control.

