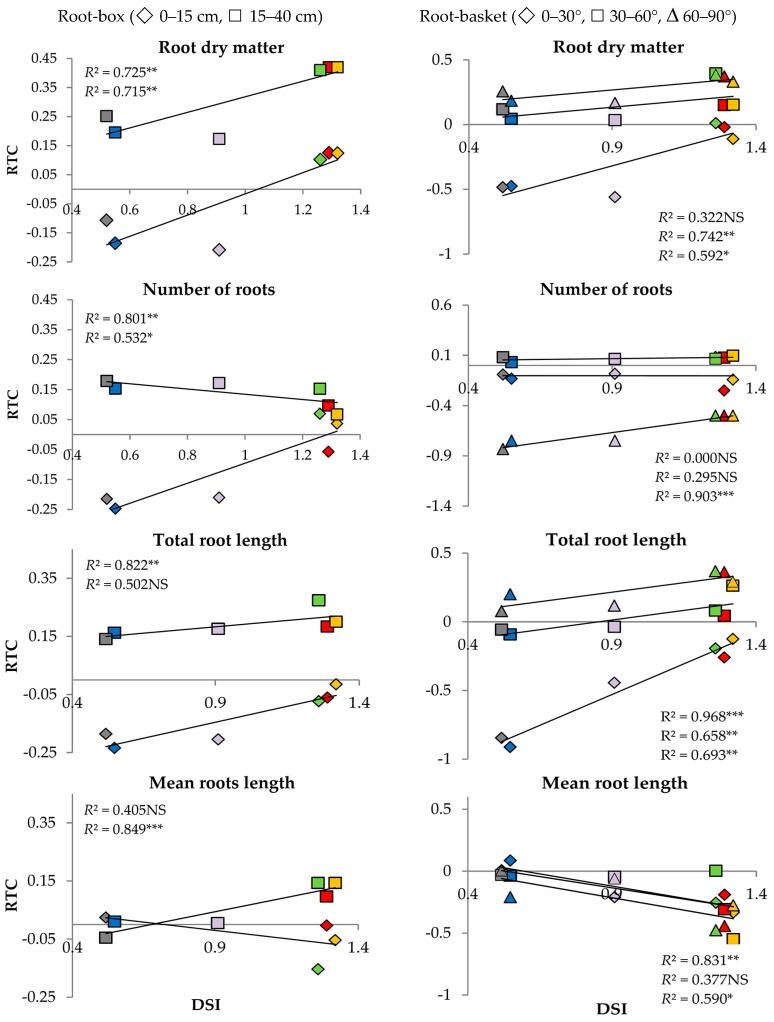
Figure 3.
Relationship between drought susceptibility index (DSI) and relative trait change index (RTC) for six wheat genotypes: Telimena (red), Sirocco (yellow), Goplana (green), Struna (blue), Sharki (violet), and SMJ 2115 (grey) in the root-box experiment and the root-basket experiment. NS—regression coefficient (R2) statistically not significant; *, **, *** R2 statistically significant at p < 0.1, 0.05, and 0.01, respectively.

