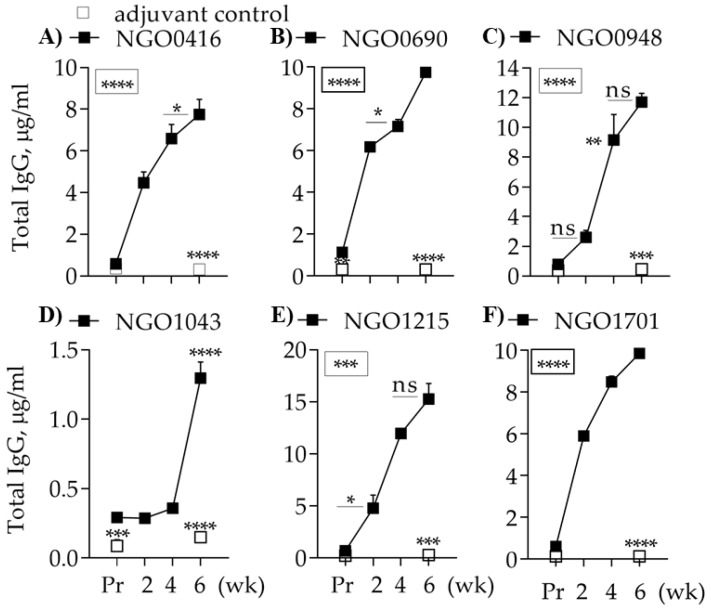
Figure 3.
Total antibody production. Total IgG (μg/mL ± SEM) measured by ELISA of mouse preimmune (Pr) and immune sera (wk 2, wk 4 and wk 6) from individual mice (n = 8) tested in duplicate. (A) NGO0416; (B) NGO0690; (C) NGO0948; (D) NGO1043; (E) NGO1215 and (F) NGO1701 (black squares). *, **, ***, *** p significant (0.05 to < 0.0001) by one-way ANOVA with Tukey’s multiple comparisons test (boxed asterisks = significance for all time points). Pooled Preimmune and immune sera (wk 6) from the adjuvant control mice group (open squares) tested in quadruplicates. ***, **** p significant (0.005 to < 0.0001) by student t test vs. antigen-specific sera at same timepoints.

