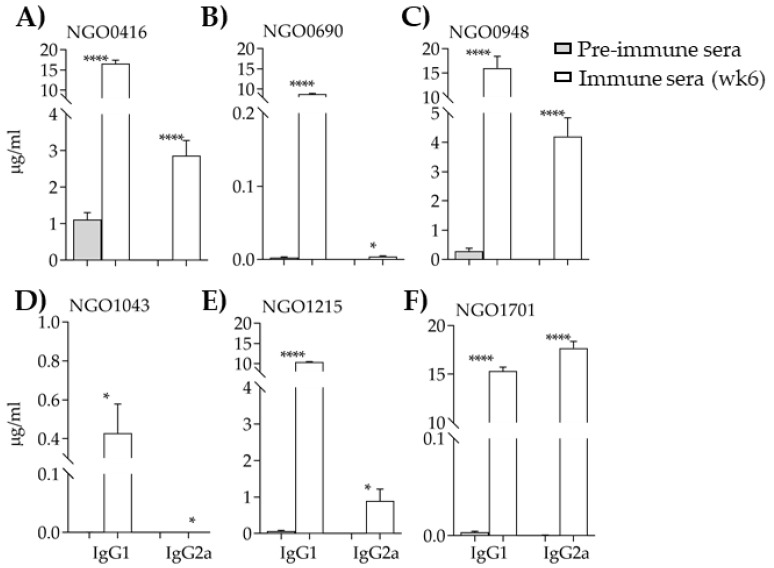
Figure 4.
IgG subclasses. IgG1 and IgG2a (μg/mL ± SEM) measured by ELISA in preimmune (gray bars) and immune sera (wk 6) (white bars). (A) NGO0416; (B) NGO0690; (C) NGO0948; (D) NGO1043; (E) NGO1215 and (F) NGO1701. *, **** p significant (0.05 to < 0.0001) by student t test between preimmune and immune sera.

