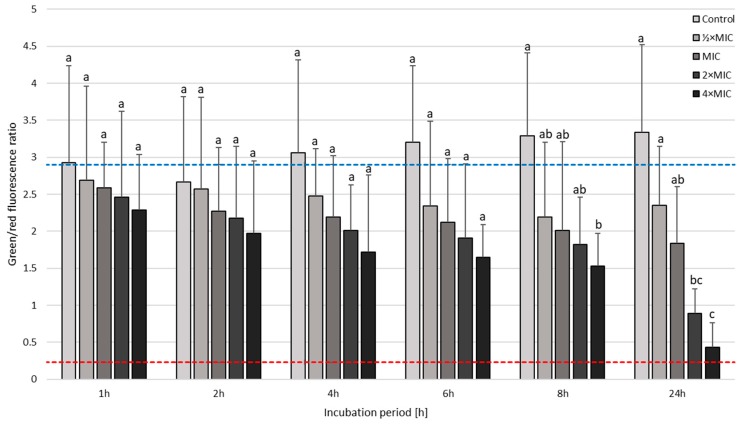
Figure 6.
The fluorescence microscopy analysis of the viability during the incubation of H. pylori Tx30a with sertraline (SER) in time. The blue top and red bottom lines indicate the positive (a 0-h incubation) and negative controls (a 1-h treatment with 70% ethanol), respectively. Columns with the same subscript letters are not significantly different from each other (p > 0.05).

