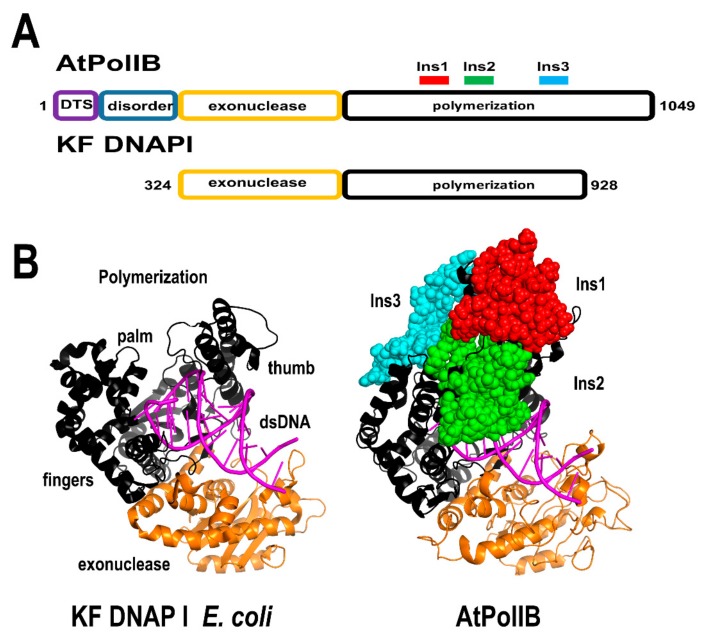
Figure 9.
Structural comparison between AtPolIB and bacterial DNAPs. (A) Domain organization of both DNAPs. The polymerization domains are colored in black and the 3′-5′ exonuclease domains in orange. The unique amino acid insertions in AtPolIB in comparison to bacterial DNAPs I are depicted in a ball-stick representation and colored in red, green, and cyan. AtPolIs contain an N-terminal DTS and a disorder region not present in the structural model. (B) homology model of AtPolIBs with the crystal structures of the Klenow fragment from E. coli DNAP I. In both models, the dsDNA from Bacillus DNAP I is superimposed.

