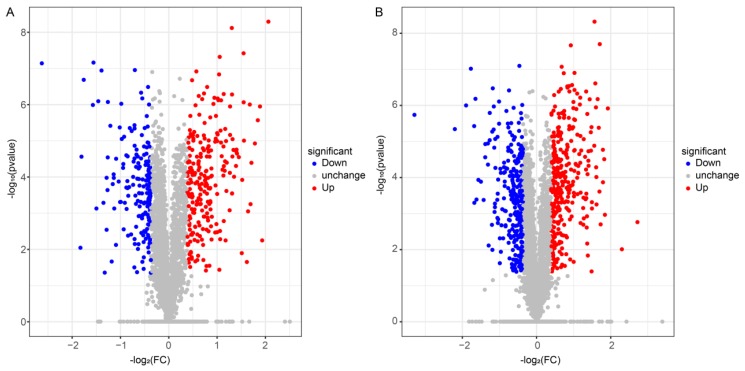
Figure 5.
Volcano plots of Differentially Expressed Proteins (DEPs) in FBT-(A) and COS-(B) treated roots. DEPs were selected by adjusted p-value < 0.05. The x-axis shows the fold change in protein expression, and the y-axis shows the statistical significance of the differences. Grey dots indicate proteins without significantly differential expression; red dots denote significantly up-regulated proteins in FBT and COS-treated roots compared to the control root; and blue dots mean significantly down-regulated proteins in FBT and COS-treated roots compared to the control root.

