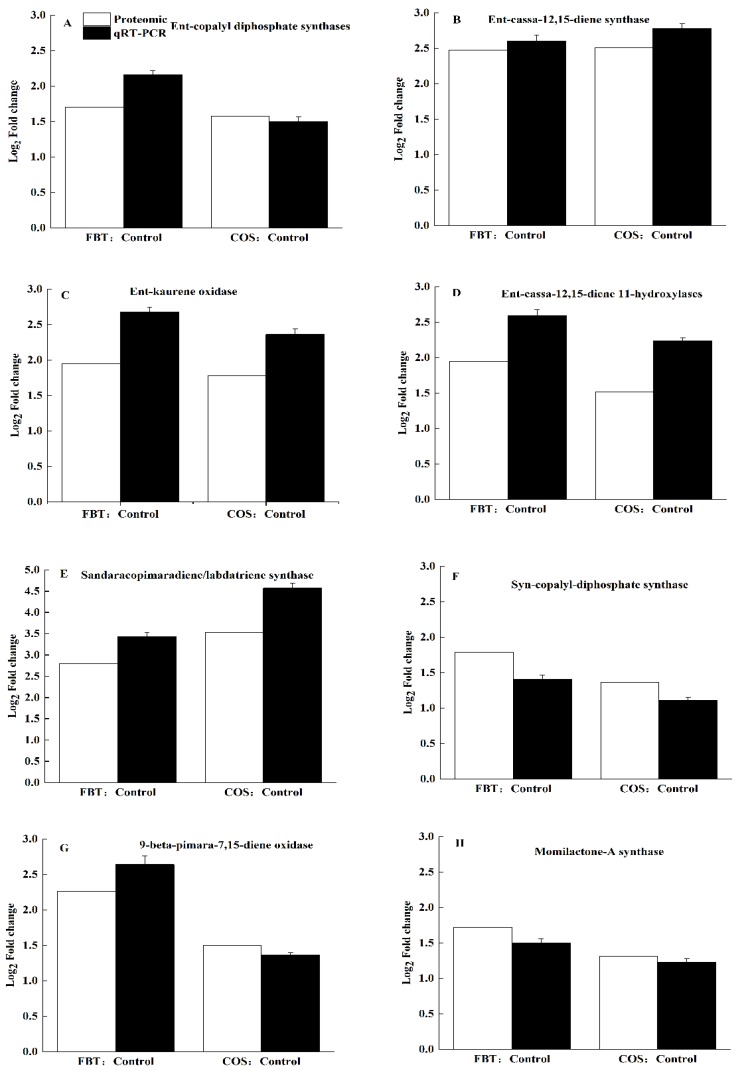
Figure 9.
Verification of the proteomic results by qRT-PCR. White bar: proteomic data for the proteins. Black bar: qRT-PCR results for the proteins. The values were the means of three replicates of three different experiments. (A) ent-copalyl diphosphate synthases, (B) ent-cassa-12,15-diene synthase, (C) ent-kaurene oxidase, (D) ent-cassa-12,15-diene 11-hydroxylases, (E) sandaracopimaradiene/labdatriene synthase, (F) syn-copalyl-diphosphate synthase, (G) 9-beta-pimara-7,15-diene oxidase, and (H) momilactone-A synthase.

