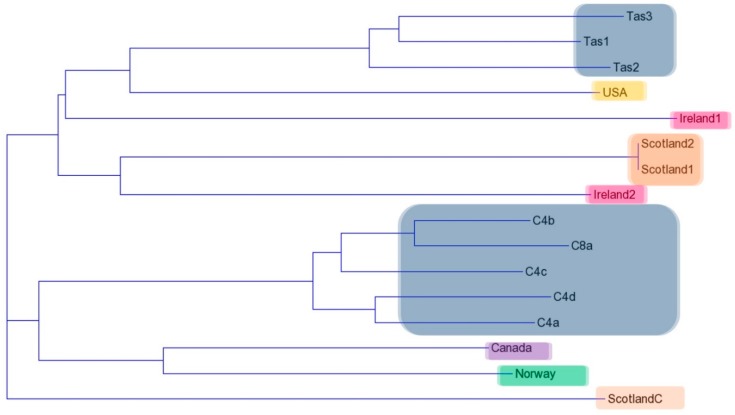
Figure 4.
Dendrogram created from the Jaccard coefficient distance matrix for the combined RAPD primer profiles (A1, A15, B10, B12 and B18). The colour blocks represent the geographic locations of each isolate (Australia—grey, Scotland—brown, Ireland—pink, USA—orange, Canada—purple and Norway—green).

