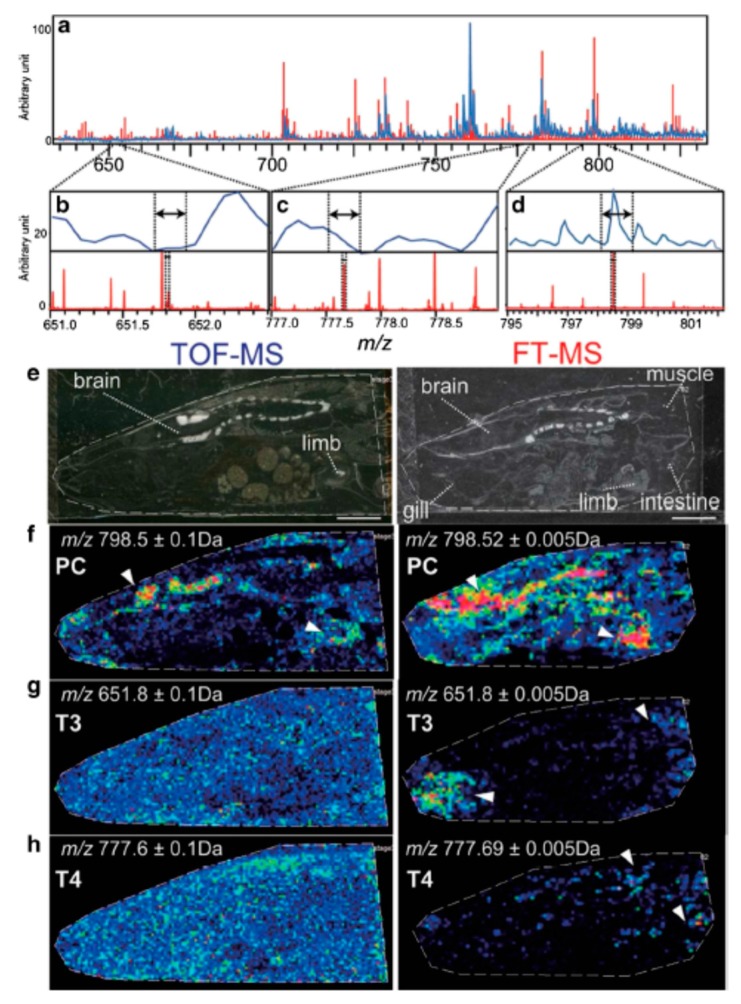
Figure 4.
Time-of-flight mass spectrometry (TOF-MS) and Fourier-transform ion cyclotron resonance (FT-ICR) MS imaging results. Mass resolution was substantially higher in the FT-ICR mass spectrum, allowing for the visualizing of the specific localization of T3 and T4 in amphibian larvae. Modified and reprinted with permission from [77]. Mass spectra of tissue sections (a–d). Optical images of the tissue sections (e) and ion images of phosphatidylcholine, T3, and T4, respectively (f–h).

