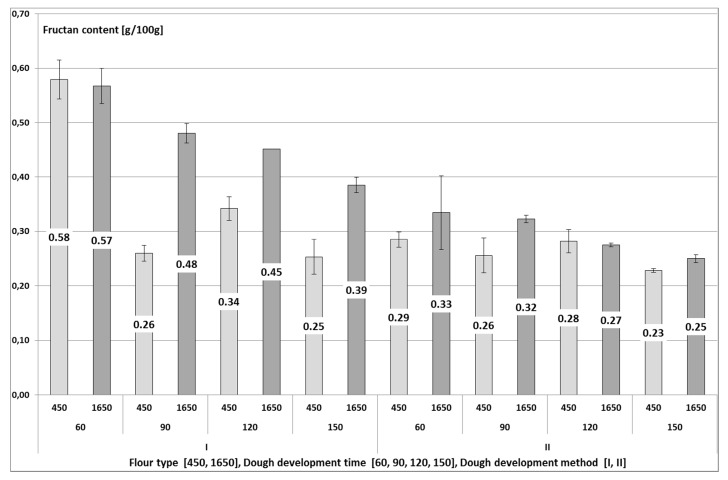
Figure 2.
The content of fructans (g/100 g d.m.) in wheat bread of different flour type (F), dough development method (M) and dough fermentation time (T). Values represent the means of two replicates. Least Significant Differences LSDF = 0.03, LSDT = 0.04, LSDM = 0.03, LSDFxT = 0.06, LSDFxM = 0.04, LSDTxM = 0.06, LSDFxTxM = 0.08.

