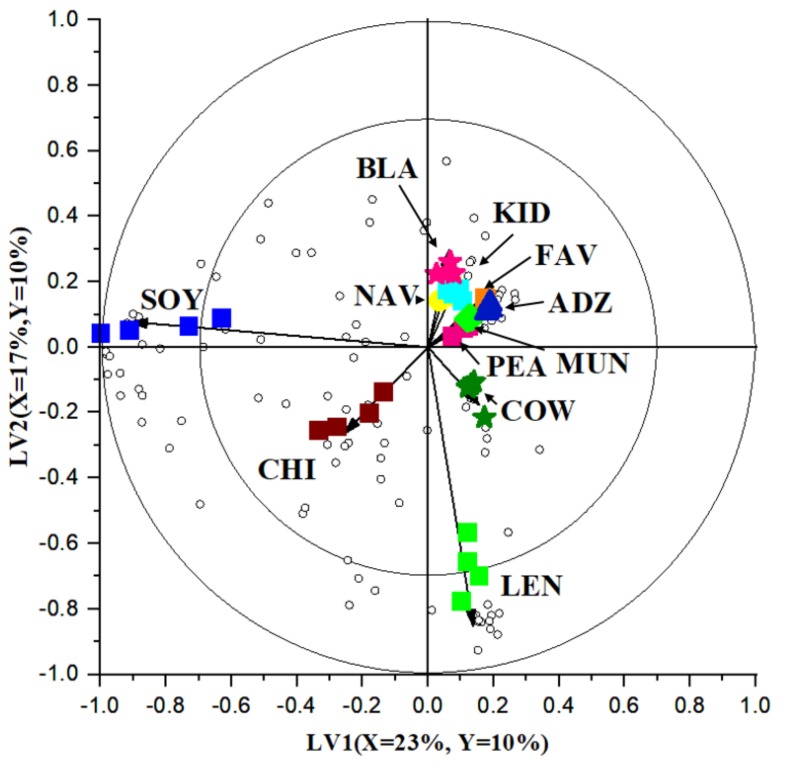
Figure 2.
A bi-plot based on partial least square discriminant analysis (PLS-DA) comparing the volatile and fatty acid profiles among the 11 types of legumes. The variance explained is (X = 22%, Y = 10%) and (X = 17%, Y = 10%) for the first and second latent variable, respectively.  = Adzuki bean (ADZ) A.
  = Chickpea (CHI)
  = Black bean (BLA)
  = Navy bean (NAV)
  = Kidney bean (KID)
  = Fava bean (FAV)
  = Mung bean (MUN)
  = Pea (PEA)
  = Soybean (SOY)
  = Cowpea (COW)
  = Orange lentil (LEN).

