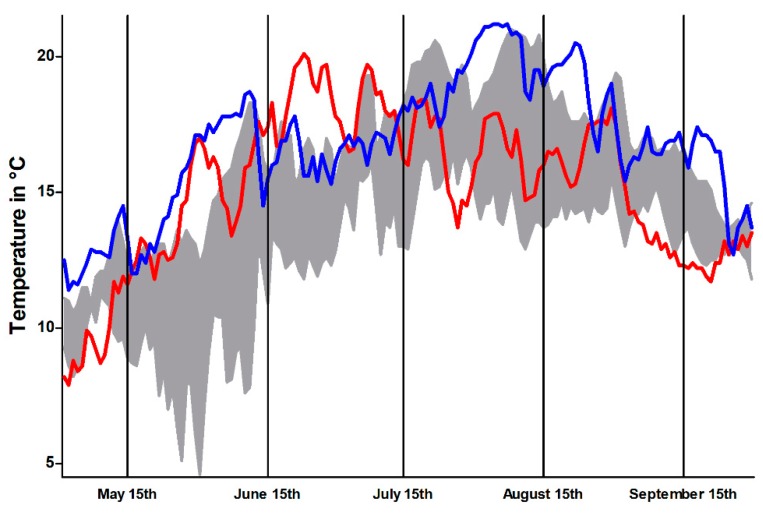
Figure 2.
Temperature profile, representing mean daily temperature within the Isar River during sampling periods in 2017 (red) and 2018 (blue), compared with temperature range of the preceding four years (grey area). Data from the Bavarian Agency of Environment (https://www.gkd.bayern.de).

