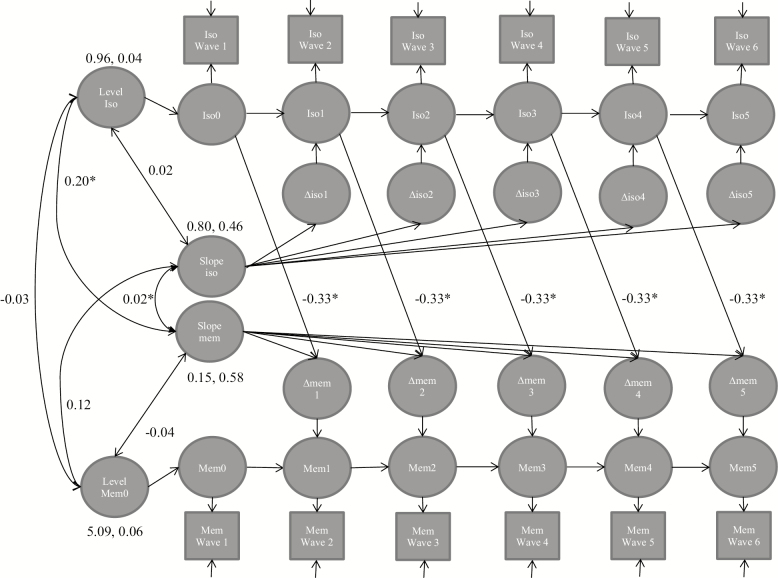
Figure 1.
Full bivariate latent change score model for men (N = 5,110). The diagram shows that the level of social isolation predicts the change in memory over the six waves. Only significant level-to-change paths are shown (see Table 1 for the estimates of all paths), paths with no coefficient are fixed to 1, fully adjusted models. The model fit: −2LL = 140,599.01, df = 469, AIC = 282,136, BIC = 285,202. Iso = social isolation, mem = memory. *p < .05, **p < .01, ***p < .001.

