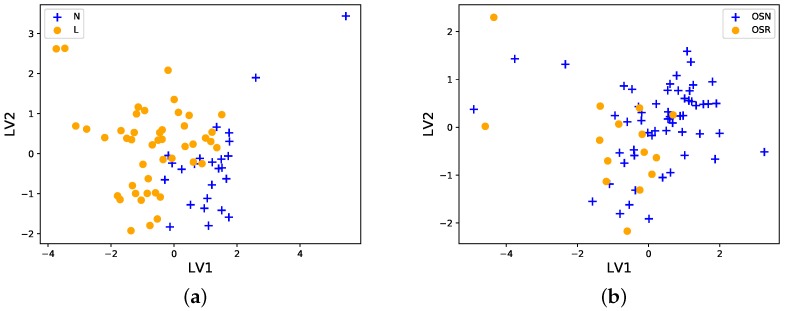
Figure 1.
PLS-DA projections of the data onto two axes, latent variable 1 (LV1) and latent variable 2 (LV2). (a) The N (blue crosses) and L (yellow circles) groups do not overlap strongly, and hence are clearly different, but at the same time they are very close to each other with some overlap. (b) The OSN (blue crosses) and OSR (yellow circles) groups can be seen to be strongly overlapping, and hence not significantly different from each other. The data were log10 transformed, and centered and scaled before projection.

