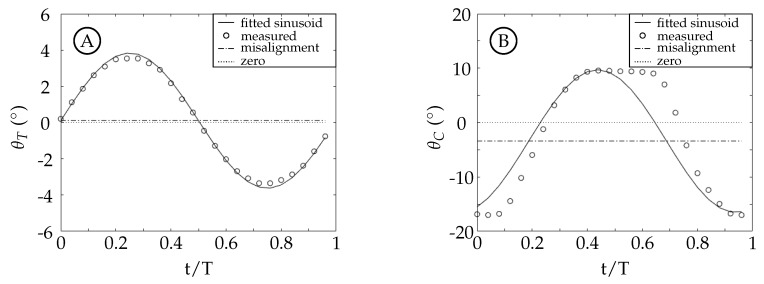
Figure 3.
Tail and caudal fin angle for two representative cases. Circles represent the measured angles; the black curve is a fitted sinusoidal curve for comparison; the dotted line is at zero; and the dot-dashed line is the angular misalignment, in (A) and in (B). (A) Tail angle, , for case 4. (B) Caudal fin angle, , for case 1.

