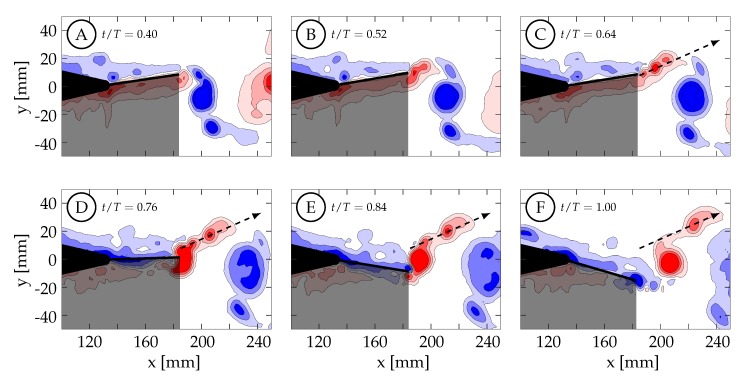
Figure 15.
(Case 1: SG1, KG1) Spanwise vorticity ( s) contours are shown here for case 1 which has , , and . Positive spanwise vorticity is shown in red and negative in blue. The dashed arrow highlights the linear trajectory of the secondary vortex. The trailing edge motion profile can be found in Figure 13A: (A) . (B) . (C) . (D) . (E) . (F) .

