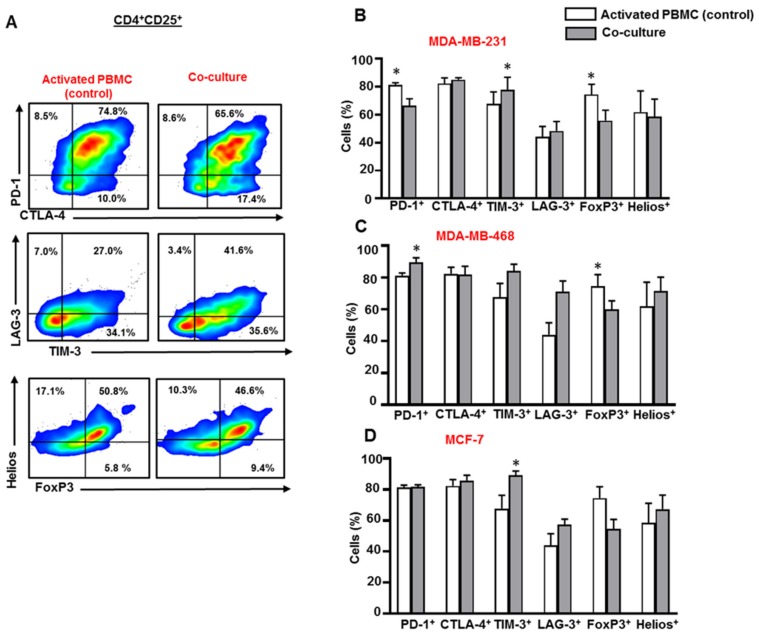
Figure 3.
Immune checkpoint and Treg-related marker expression on CD4+CD25+ T cells in co-culture with breast cancer cells. Activated PBMCs were co-cultured with MDA-MB-231, MDA-MB-468, and MCF-7 cells for 72 h. Cells were then stained for immune checkpoints and FoxP3/Helios expression, and analyzed by flow cytometry. Representative flow cytometric plots show PD-1, CTLA-4, TIM-3, LAG-3, FoxP3 and Helios expression in CD4+CD25+ T cells from activated PBMC and MDA-MB-231 co-culture (A). Bar plots show the differences in IC, FoxP3 and Helios expression in CD4+CD25+ T cells in the presence or absence of MDA-MB-231 (B), MDA-MB-468 (C) and MCF-7 (D) cells. Data represent the mean + SEM of four independent experiments.

