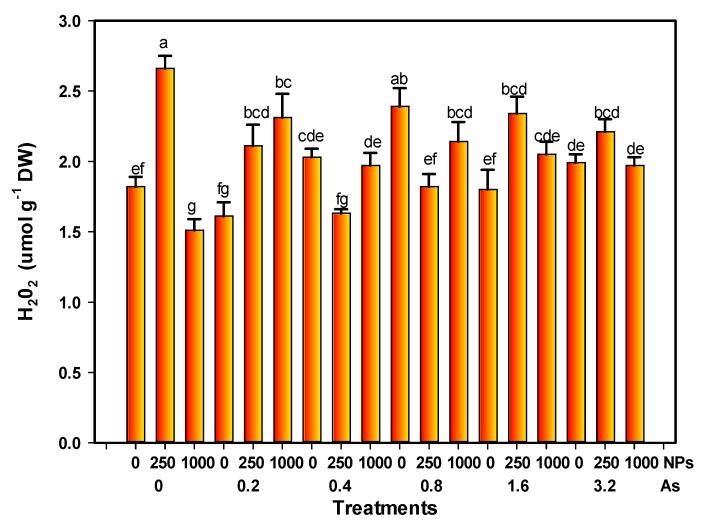
Figure 6.
H2O2 content of tomato fruits with application of SiO2 NPs and stressed by arsenic. Different letters above the columns indicate significant differences according to Fisher’s Least Significant Difference test (p ≤ 0.05). NPs: Dose applied of SiO2 NPs (mg L−1); As: Dose applied of arsenic (mg L−1).

