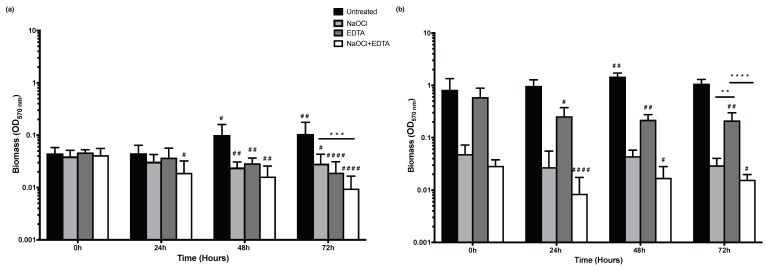
Figure 6.
The effect of the three treatment conditions: NaOCl, EDTA and NaOCl + EDTA on pre-formed 24 h biofilms biomass in relation to untreated biofilms. Crystal violet (CV) readings were taken at 0, 24, 48 and 72 h. Values were plotted as log10 on the Y axis. (a) Biofilm biomass for LBF (b) Biofilm biomass for HBF. Statistical significance between the three treatment conditions at 72 h was presented as ** p < 0.01, *** p < 0.001 and **** p < 0.0001. Whereas the significant difference in relation to untreated biofilms of the same treatment condition over time was presented as # p < 0.05, ## p < 0.01 and #### p < 0.0001.

