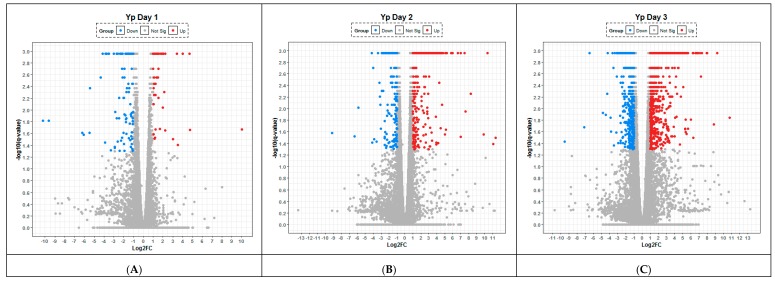
Figure 3.
Lung transcriptome following aerosol infection of Balb/C mice with Yersinia pestis. Temporal changes are presented after (A) 24, (B) 48 and (C) 72 h following infection with the organism. Any gene that has log-fold change less than 2 versus uninfected control are labelled in grey, significantly up- (red) and down-regulated (blue). The statistical significance (−log10 of the p-value) of each gene within the transcriptome is shown on the y-axis.

