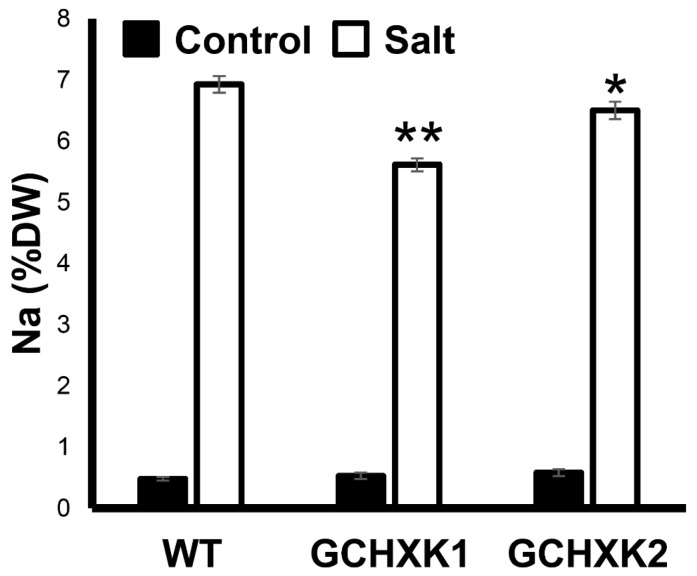
Figure 6.
GCHXK plants under salt stress accumulates significantly less Na than WT plants. Na contents of GCHXK and WT plants under saline (white) and control (black) conditions. Data given as means ± SE, n = 9. Asterisks denote significant differences relative to the WT (t-test, * p < 0.05; ** p < 0.01).

