Figure 5.

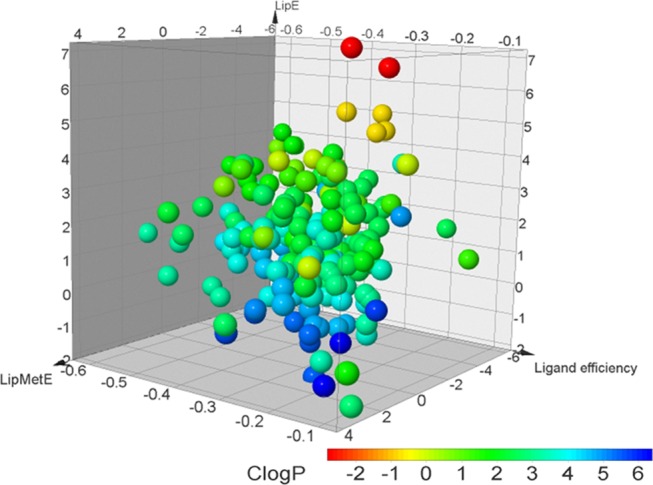
CYP450 substrates represented as points in the 3D space mapped according to the respective LipE, LipMetE, ligand efficiency values and points color-coded according to the c log P values.

CYP450 substrates represented as points in the 3D space mapped according to the respective LipE, LipMetE, ligand efficiency values and points color-coded according to the c log P values.