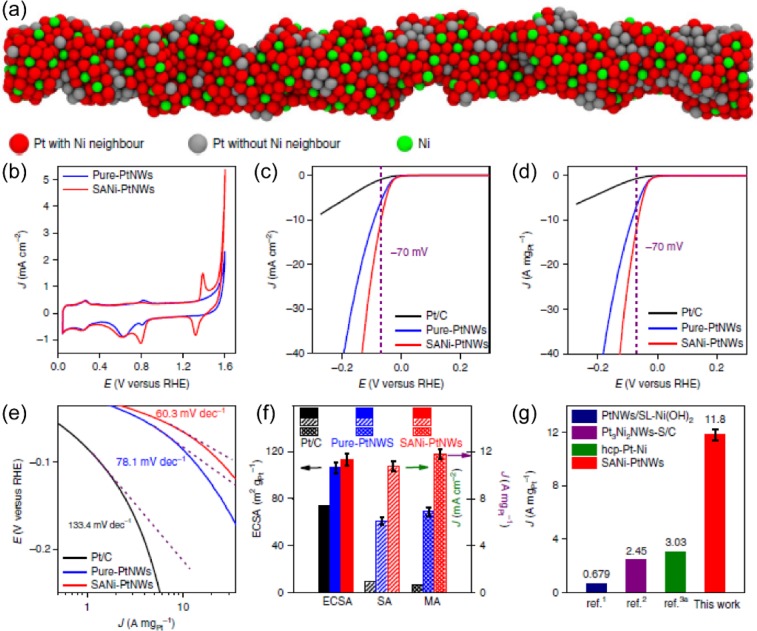
Figure 3.
(a) Structural diagram of single atomic nickel species on ultrafine Pt nanowires (SANi-PtNWs). (b) Cyclic voltammetry curves of SANi-PtNWs and pure-PtNWs. LSV curves obtained by normalizing (c) ESCA and (d) Pt mass loading, (e) Tafel slope plot normalized by Pt mass loading, and (f) ECSA and special activity comparison of SANi-PtNWs, pure-PtNWs, and commercial Pt/C. (g) Mass activity comparison of SANi-PtNWs with those reported catalysts. Reproduced with permission from ref (7). Copyright 2019 Nature Publishing Group.

