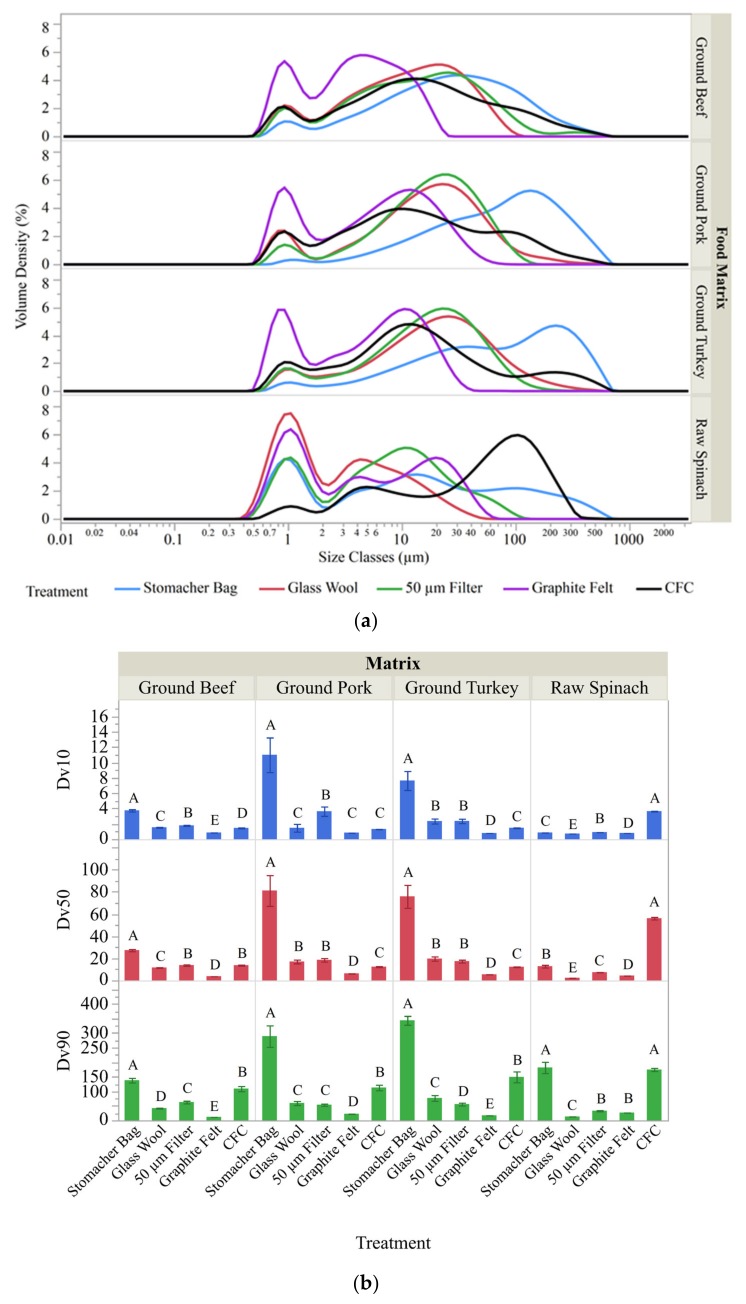
Figure 2.
Particle size analysis. (a) Particle size distribution was determined with dynamic light scattering. Sample matrices consisted of ground beef, ground pork, ground turkey and spinach as indicated on the right axis. All samples were initially processed via a filtered stomacher bag (blue line) to mix the sample and remove extremely large particulates and is considered the pre-filtration reference point for these experiments. Samples were then subjected to the stated separation methods and the particle size distribution is shown post-processing via glass wool – red line; 50 μm filter – green line; graphite felt – purple line; and continuous flow centrifugation (CFC) – black line. (b) Average values collected for treated samples corresponding to the size points in the distribution patterns where 10, 50, or 90% of the total material volume was either equal to or smaller than the listed size (Dv 10, Dv 50, or Dv 90 respectively) are grouped by food matrix. Student’s t-tests were utilized to compare the effect of treatments on the Dv 10, Dv 50 and Dv 90 calculated from particle size distribution data. Statistically different values (p < 0.05) are indicated by the connecting letters report. The letters are organized within groups from A-E with the alphabetical progression being associated with lower means.

