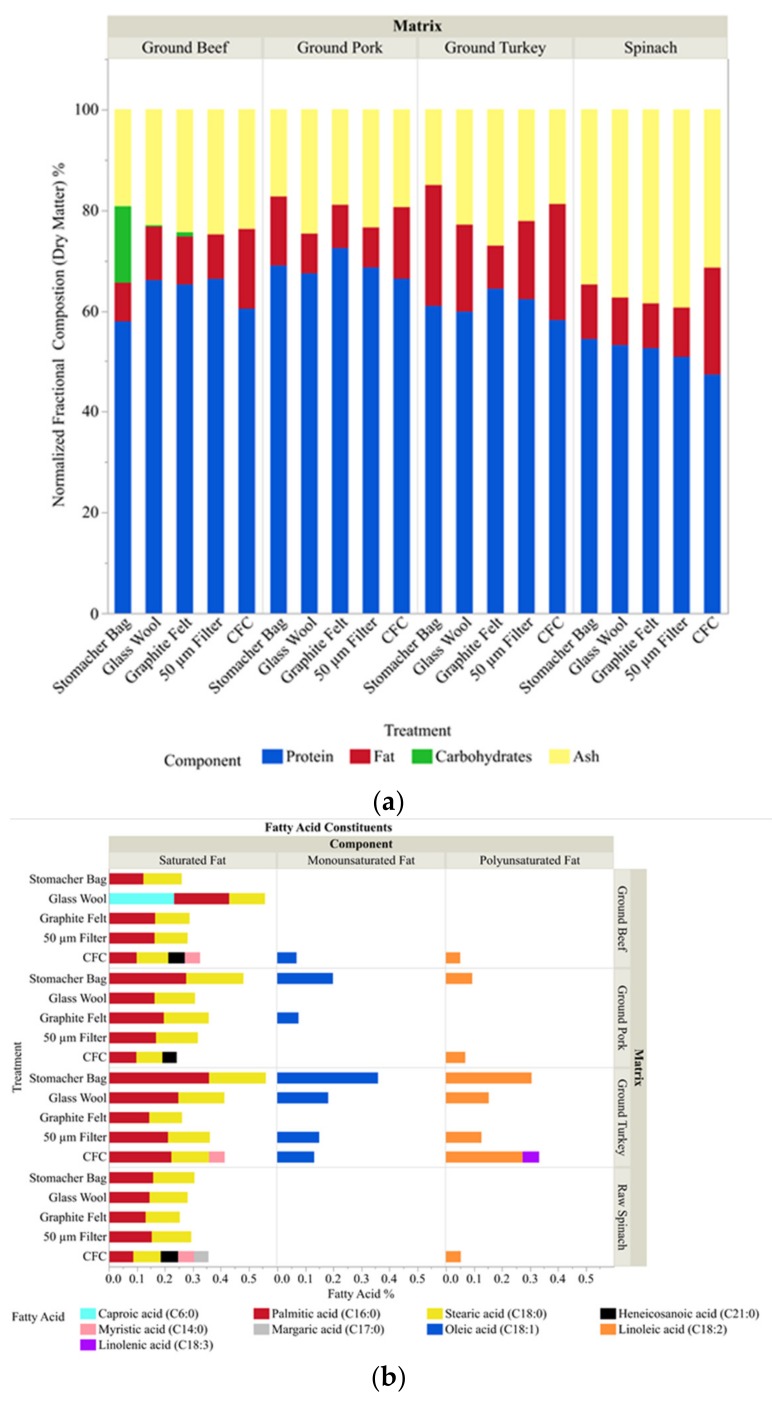
Figure 3.
Sample composition. (a) The relative amount of protein, carbohydrate, fat, and ash within each sample was determined based on dry matter basis. The data was normalized by dividing each measured (or calculated) dry matter value by the total protein, fat, carbohydrates and ash content. (b) Delineation of fats found within the homogenate of the individual samples into their fatty acid constituents.

