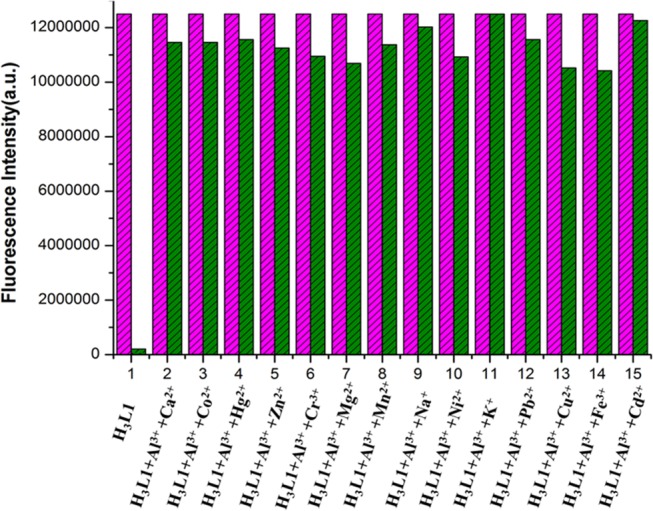
Figure 4.

Relative fluorescence intensity diagram of [H3L1-Al3+] system in the presence of different cations in 10 mM HEPES buffer at pH 7.4. 1 = only H3L1 and (2–15) = H3L1 (10 μM) + Al3+ (10 μM) + Mn+ (40 μM), where Mn+ = (2—Ca2+, 3—Co2+, 4—Hg2+, 5—Zn2+, 6—Cr3+, 7—Mg2+, 8—Mn2+, 9—Na+, 10—Ni2+, 11—K+, 12—Pb2+, 13—Cu2+, 14—Fe3+, 15—Cd2+).
