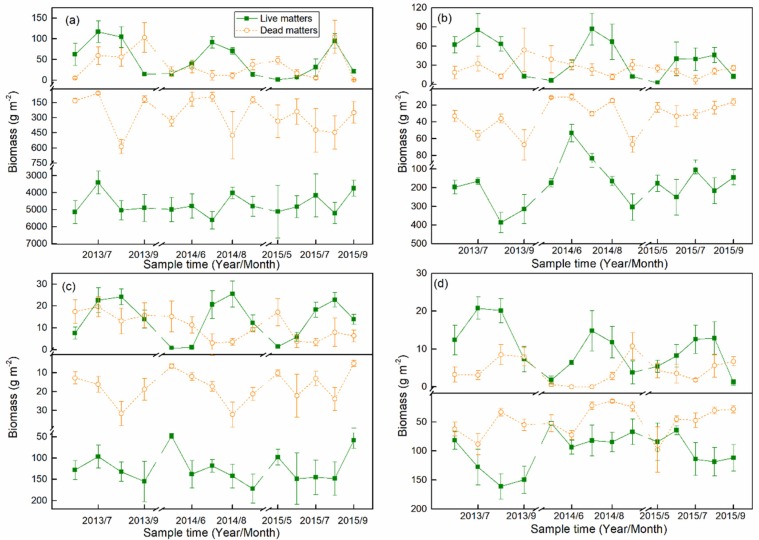
Figure 1.
Monthly biomass dynamics for four alpine grasslands from 2013 to 2015. (a) Alpine meadow (AM), (b) alpine meadow steppe (AMS), (c) alpine steppe (AS), and (d) alpine desert steppe (ADS). “Live matters” represent the aboveground (upper insets from (a) to (d)) and belowground (bottom insets from (a) to (d)) live biomass (AGB and BGB), and the same to “Dead matters”. Error bars are the standard deviation of five repeated samples.

