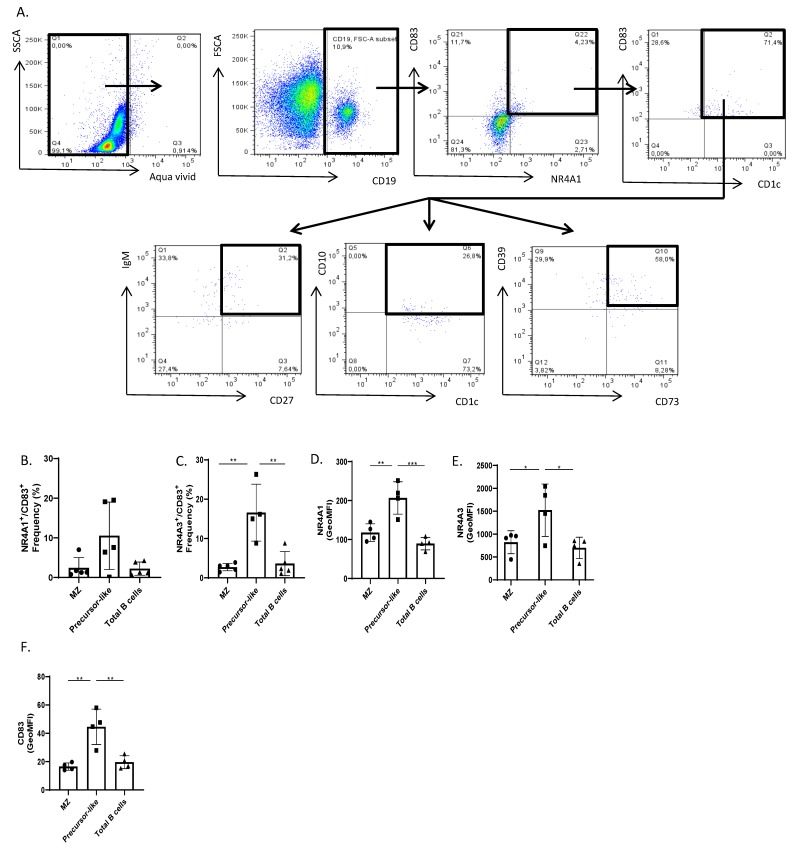
Figure 2.
Flow-cytometry analyses of NR4A1, NR4A3, CD83, CD39, and CD73 expression by live ex vivo unstimulated human blood B-cells. (A) Gating strategy: Singlet Live CD19+ B-cells were analyzed for NR4A1 or NR4A3 and CD83 co-expression. NR4A1+ or NR4A3+ (not shown) CD83+ B-cells were then analyzed for CD1c expression, and subsequently for IgM and CD27 expression, for CD10 expression, and for CD39 and CD73 expression. (B) Relative frequencies of NR4A1 and CD83 and (C) NR4A3 and CD83 co-expressing marginal zone (MZ), precursor-like MZ and total B-cells were compared with an ANOVA with post-hoc Tukey test. (A–C) Data are representative of 5 healthy donors. (D) Levels of expression as determined by geometric mean fluorescence intensity (GeoMFI) of NR4A1, (E) NR4A3, and (F) CD83 for MZ, precursor-like MZ and total B-cells were compared with an ANOVA with post-hoc Tukey test. (D–F) Data are representative of four healthy donors. Significance levels are shown as * (p < 0.05), ** (p < 0.01), *** (p < 0.001).

