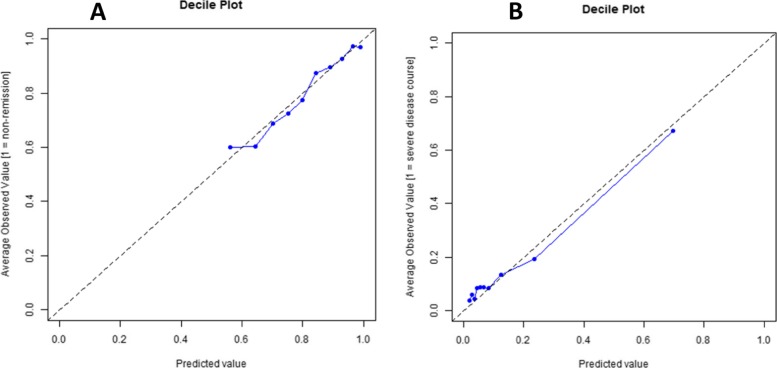
Fig. 3.
Calibration curves for the Nordic model to predict non-achievement of remission fine-tuned to Canadian data. a When predicting non-achievement of remission. b When predicting a severe disease course. Each point represents one tenth of the testing patient sample, arranged from lowest to highest probability of the outcome

