
Fig. 9.
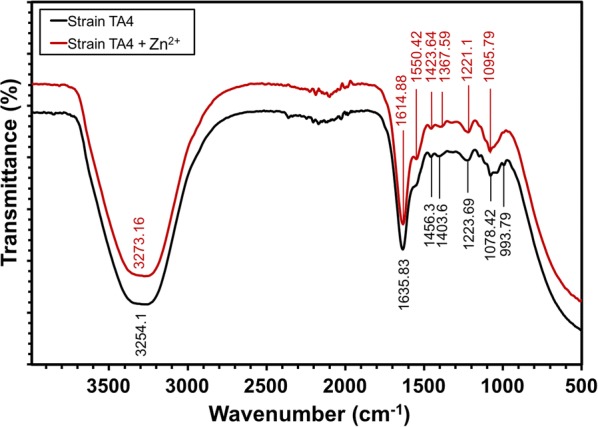
Comparison of FT-IR spectral analysis of L. plantarum strain TA4 (c). The black vibrational lines indicate the control of cell biomass (unexposed to Zn2+) and the red line indicate the cell biomass exposed to Zn2+
Official websites use .gov
A
.gov website belongs to an official
government organization in the United States.
Secure .gov websites use HTTPS
A lock (
) or https:// means you've safely
connected to the .gov website. Share sensitive
information only on official, secure websites.
Comparison of FT-IR spectral analysis of L. plantarum strain TA4 (c). The black vibrational lines indicate the control of cell biomass (unexposed to Zn2+) and the red line indicate the cell biomass exposed to Zn2+