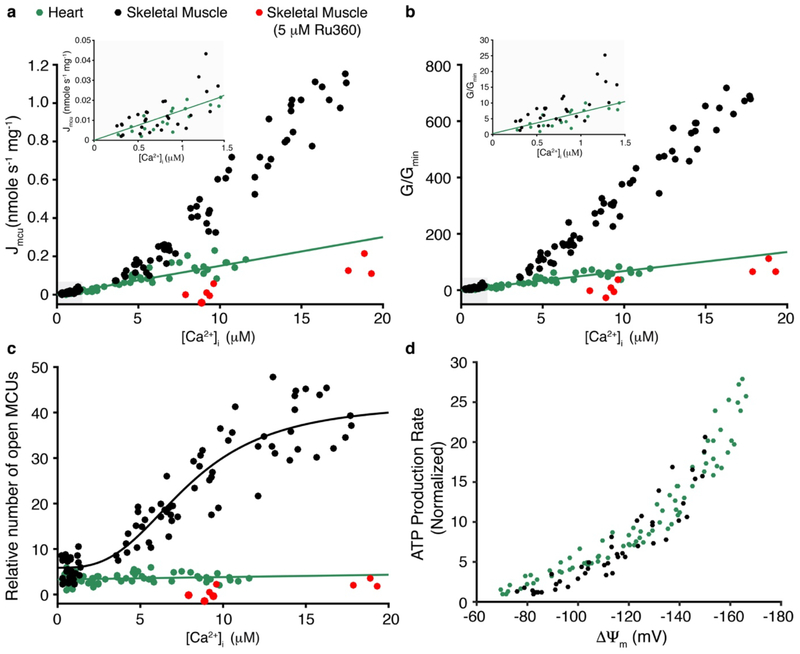
Extended Data Figure 8. MCU conductance and voltage dependence of ATP production in heart and skeletal muscle.
a. Measurement of the MCU-dependent Ca2+ influx (Jmcu) (nmole mg−1 s−1) in cardiac mitochondria (green circles, from Fig. 3), skeletal muscle (black circles), and skeletal muscle with Ru360 (5 μM) (red circles) is plotted as a function of measured [Ca2+]i (n = 63, n = 87, and n = 12 independent experiments, respectively, each with [Ca2+]i, [Ca2+]m and ΔΨm measured). Linear least-squares fit to the heart mitochondria data is shown (slope = 0.015). b. MCU conductance (G) for each measurement shown in (a) normalized to the minimal conductance (Gmin) of the cardiac dataset (G/Gmin) plotted as a function of [Ca2+]i. Linear least-squares fit line to the heart mitochondria data is shown (slope = 6.1). c. Relative number of open MCUs per mitochondrion plotted as a function of [Ca2+]i. Taken from (b) after dividing by the [Ca2+]i-dependent unitary conductance of MCU and normalized to the minimal number of open MCUs of the cardiac dataset. Linear least-squares fit to the heart mitochondria data is shown (slope = 0.051, intercept = 3.3). For skeletal muscle data under [Ca2+]i of 1.5 μM the measurements were done using stopped flow as described in Extended Data Fig 5. Jmcu at [Ca2+]i above 1.5 μM was collected using a multi-well plate reader with ΔΨm set using a K+ gradient and the K+ ionophore valinomycin. Skeletal muscle data is fit to a modified Hill equation with a K0.5 of 7.9 μM and a Hill coefficient of 2.95. d. The dependence of ATP production on ΔΨm in the absence of carbon substrates and at [Ca2+]m < 200 nM. The measurements of ATP production rates are normalized to the minimal production rate of each data set. Measurements from heart mitochondria are shown in green circles (n= 77, replotted from Fig. 4a), the measurements from skeletal muscle mitochondria are in shown in black circles (n= 45 independent experiments). ΔΨm was set by using a fixed K+ gradient and the K+ ionophore valinomycin (see Methods).

