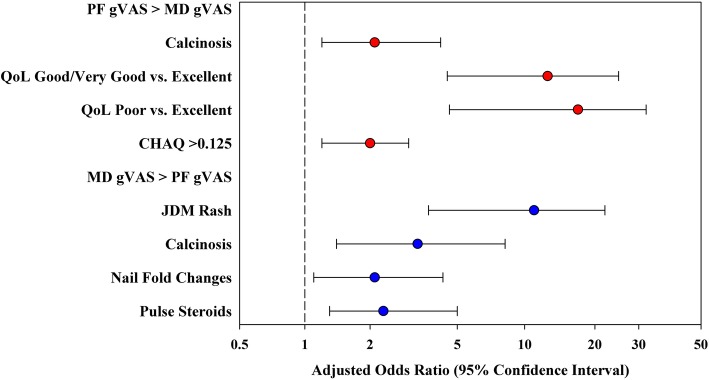
Fig. 1.
Forest plot illustrating the adjusted odds ratios and 95% confidence intervals for each significant independent predictor of PF and MD discordance in gVAS. Discordance is defined as at least a 2-point difference on the 0–10 VAS scale. The red circles indicate predictors increasing the odds of discordance, where PF > MD. The blue circles denote predictors increasing the odds of discordance, where MD > PF

