
Table 4A.
Impact of cumulative use of antibiotics on progression‐free survival
| Covariates | p value | Hazard ratio (95% CI) |
|---|---|---|
| ECOG performance status | ||
| 1 vs. 0 | .198 | 1.270 (0.883–1.829) |
| 2+ vs. 0 | .0006 | 3.141 (1.638–6.025) |
| Comorbidies, yes. vs. no | .022 | 1.425 (1.052–1.930) |
| Cumulative use of antibiotics | ||
| Single course vs. no | .279 | 1.324 (0.796–2.200) |
| cumulative courses vs. no | .026 | 2.625 (1.245–6.127) |
| Interaction of ECOG PS and use of antibiotics | ||
| PS = 1 and single ABX | .856 | 0.929 (0.420–2.057) |
| PS ≥2 and single ABX | .385 | 0.599 (0.188–1.905) |
| PS = 1 and cumulative ABX | .937 | 0.959 (0.341–2.698) |
| PS ≥2 and cumulative ABX | .021 | 0.225 (0.063–0.798) |
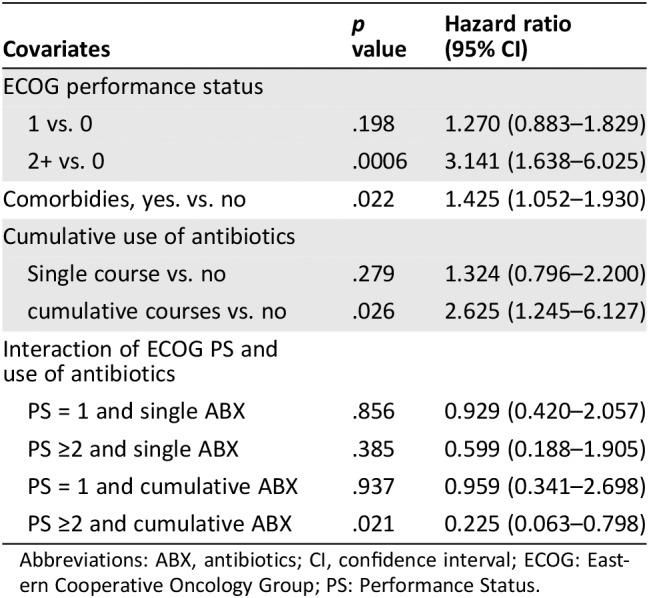
Abbreviations: ABX, antibiotics; CI, confidence interval; ECOG: Eastern Cooperative Oncology Group; PS: Performance Status.