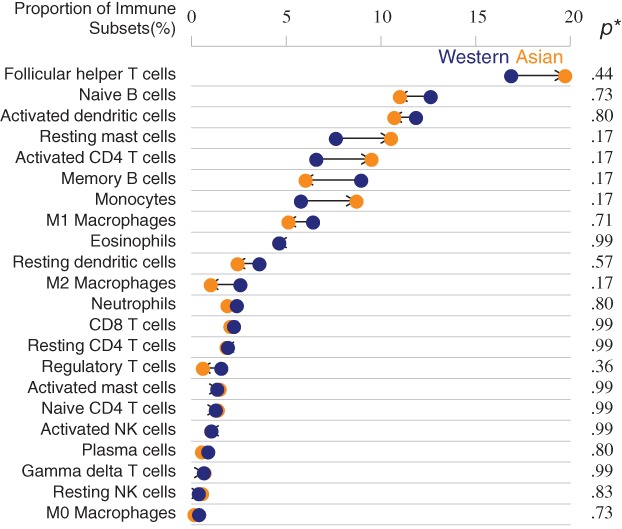
Figure 3.

Proportions of immune cell subsets in Asian and Western breast tumors. Monocytes, M1 macrophages, gamma‐delta T cells, naive CD4 T cells, and regulatory T cells exhibited different percentage between races, but statistical analysis was insignificant. * indicates p value calculated by proportional z test with Benjamini‐Hochberg adjustment.
Abbreviation: NK, natural killer.
