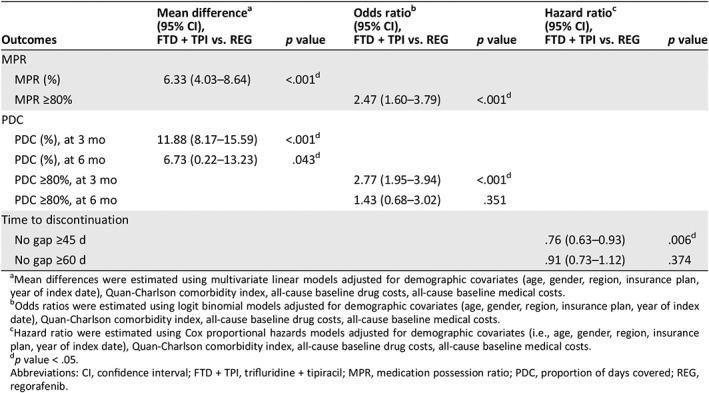
Table 3.
Comparison of persistence and adherence
| Outcomes | Mean differencea (95% CI), FTD + TPI vs. REG | p value | Odds ratiob (95% CI), FTD + TPI vs. REG | p value | Hazard ratioc (95% CI), FTD + TPI vs. REG | p value |
|---|---|---|---|---|---|---|
| MPR | ||||||
| MPR (%) | 6.33 (4.03–8.64) | <.001d | ||||
| MPR ≥80% | 2.47 (1.60–3.79) | <.001d | ||||
| PDC | ||||||
| PDC (%), at 3 mo | 11.88 (8.17–15.59) | <.001d | ||||
| PDC (%), at 6 mo | 6.73 (0.22–13.23) | .043d | ||||
| PDC ≥80%, at 3 mo | 2.77 (1.95–3.94) | <.001d | ||||
| PDC ≥80%, at 6 mo | 1.43 (0.68–3.02) | .351 | ||||
| Time to discontinuation | ||||||
| No gap ≥45 d | .76 (0.63–0.93) | .006d | ||||
| No gap ≥60 d | .91 (0.73–1.12) | .374 |

Mean differences were estimated using multivariate linear models adjusted for demographic covariates (age, gender, region, insurance plan, year of index date), Quan‐Charlson comorbidity index, all‐cause baseline drug costs, all‐cause baseline medical costs.
Odds ratios were estimated using logit binomial models adjusted for demographic covariates (age, gender, region, insurance plan, year of index date), Quan‐Charlson comorbidity index, all‐cause baseline drug costs, all‐cause baseline medical costs.
Hazard ratio were estimated using Cox proportional hazards models adjusted for demographic covariates (i.e., age, gender, region, insurance plan, year of index date), Quan‐Charlson comorbidity index, all‐cause baseline drug costs, all‐cause baseline medical costs.
p value < .05.
Abbreviations: CI, confidence interval; FTD + TPI, trifluridine + tipiracil; MPR, medication possession ratio; PDC, proportion of days covered; REG, regorafenib.
