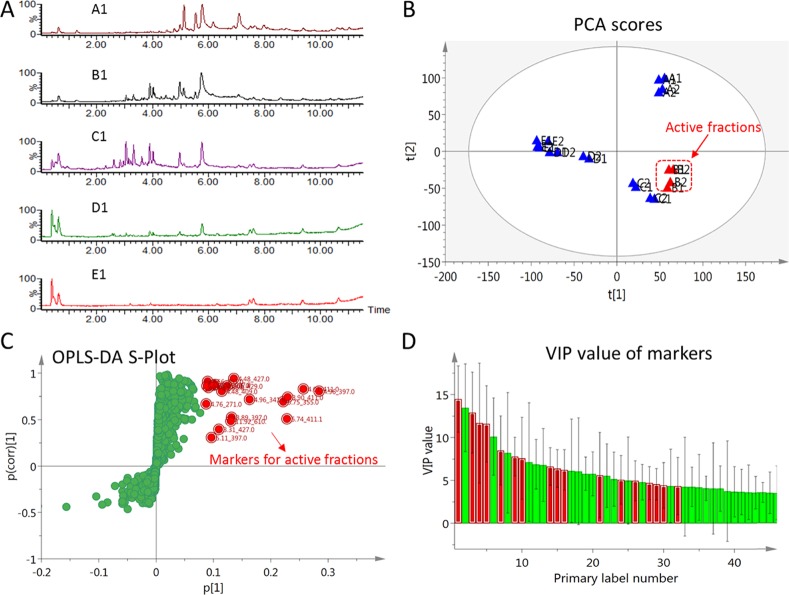
Figure 2.
UPLC-MS combined with multivariate analysis to determine markers from the most active fractions of the mangosteen pericarp extract. (A) Total ion chromatograms (TIC) of different fractions isolated by silica gel chromatography (positive mode). A1, B1..., E1 represented the TIC of selected fractions A1, B1..., E1. (B) Untargeted PCA analysis of all the fractions, R2X[1] = 0.22 and R2X[2] = 0.15, drawn with Hotelling’s 95% confidence ellipse; the red highlight shows the active fractions. A1, A2, B1..., E2 indicated the fractions A1, A2.., E2, as shown in Figure 1. (C) S-plots based on OPLS-DA analysis to determine molecular ions of markers for the active fractions (inactive group, −1; active group, 1). R2Y = 0.98 and Q2 = 0.85. Red dots indicate the priority potential biomarkers in active groups. (D) Variable importance in the projection (VIP) obtained from the OPLS-DA model for the most discrimination among active fractions from inactive fractions. Red bar graphs correspond to the selected markers in OPLS-DA.

